
Python - Data Science Libraries Simplified
A simple overview of most used libraries with the minimal or no-code approach.

The typical life cycle of a data science project involves jumping back and forth among various interdependent data science tasks using a range of tools, techniques, frameworks programming, etc.
A data scientist typically needs to be involved in tasks like data wrangling, exploratory data analysis (EDA), model building and visualisation.
Python provides almost all the necessary tools/libraries to effectively carry out these tasks, with dedicated libraries for each step.
Let's look at these awesome libraries.
Pandas - Excel inside Python
- Open-source, fast, powerful, flexible and easy to do data analysis and manipulation.
- Built on top of the Numpy package, a lot of the structure of Numpy is used or replicated in Pandas.
- Before all fancy machine learning, we will have to explore, clean and process the data thoroughly. For that, we need Pandas.
We can work with missing values in a single line of code!
There are 2 options to try:
- Get rid of rows or columns with nulls.
df.isnull().sum() # df - A pandas DataFrame, that has null values. Find total null values.
df.dropna() # Drop all Null values
- Replace nulls with non-null values, known as imputation.
df.fillna(mean_value)   # Fill all Null values with mean value of that column. mean_value is a variable that stores the mean value. All Null values will be filled.

df[col1].fillna(mean_value_col1)    # Fill Null values of col1 with mean value of col1.
Imputation is a conventional engineering technique used to keep valuable data (rows) that has null values. It aims to replace missing data with substituted values. Imputation can help with regularization and generalization as or when needed.
One alternative to looping in pandas is to use the apply method.
df[col1].apply(lambda x: x.lower()) # Apply given lambda function to all values in column col1.
We can give an additional parameter axis to almost all methods in pandas, where we can define if we want the method to operate row-wise or column-wise.
Scikit-Learn - Machine Learning Done Right
- A Machine Learning library for Python with in-built ML algorithms - vector machine, random forests and k-neighbours.
- Built on Numpy, SciPy and Matplotlib. Yeah, SciPy is different from Sklean.
- Scikit-Learn comes with a few standard data sets, for instance, the iris and digits data sets for classification and the diabetes data set for regression.
Scikit-Learn also offers multiple ways to impute missing values.
There are 2 approaches, one with the SimpleImputer class that provides basic strategies for imputing missing values, through mean or median for example. Second, a more sophisticated approach is using the KNNImputer class, which provides imputation for filling in missing values using the K-Nearest Neighbors approach. The values of the neighbours are averaged uniformly or weighted by distance to each neighbour.
Matplotlib, Seaborn and Plotly - The Three Musketeers of Visualisation
Matplotlib is considered the old grandfather of the Python visualisation packages. It originated nearly a decade ago before Pandas and hence isn't outlined for utilising the Pandas DataFrame. So for visualising Pandas DataFrame, we have to extract each Series and often concatenate them together into the right formate. We can typically do anything we need with the Matlplotlib library, but this is not often simple to figure out.
Seaborn gives an API on Matplotlib that does rational choices for the plot fashion and colour defaults, characteristics straightforward high-level capacities for common measurable plot sorts, and coordinates with the usefulness of Pandas.
Plotly is JSON based plot tool for interactive visualisation. Graphs or plots can be defined by a JSON object using 2 keys, named data and layout. It can create interactive features easily. Most plots come with hover labels, and legends for groups is another amazing feature of this library.
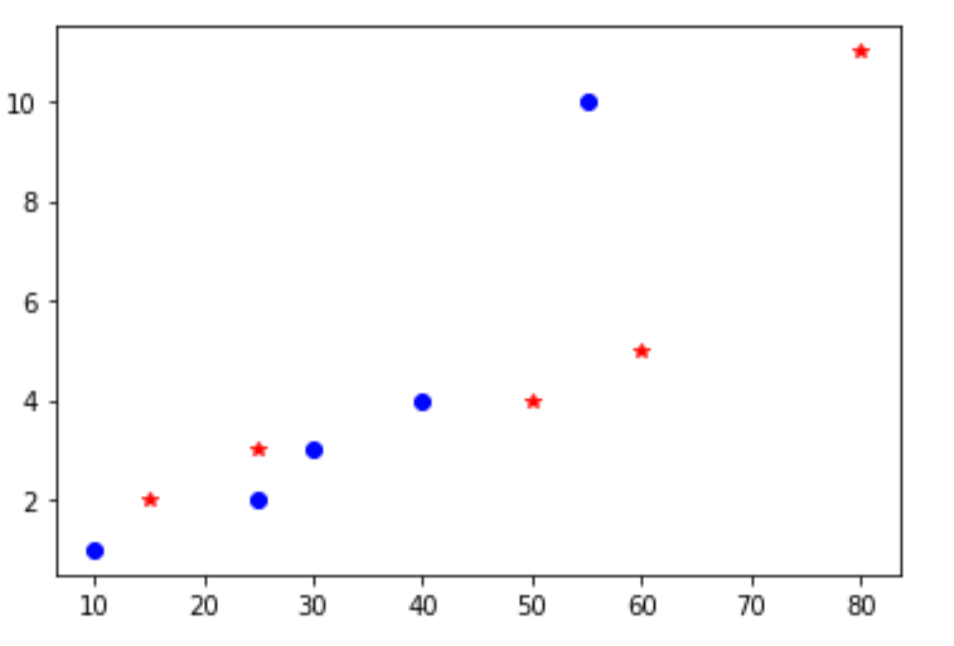
A simple plot using Matplotlib:
import matplotlib.pyplot as plt
%matplotlib inline

plt.plot([10, 25, 30, 40, 55], [1, 2, 3, 4, 10], 'bo')
plt.plot([15, 25, 50, 60, 80], [2, 3, 4, 5, 11], 'r*')
plt.show()
This plots points on the x-y plane. bo for blue dots and r* for red stars.
In statistical data visualisation, all you want is to plot histograms and joint distributions of variables. Rather than a histogram, we can get a smooth estimate of the distribution using a kernel density estimation, which Seaborn does with sns.kdeplot
import seaborn as sns
sns.set()
import numpy as np
import pandas as pd

data = np.random.multivariate_normal([0, 1], [[5, 6], [6, 2]], size=30000)
data = pd.DataFrame(data, columns=['X', 'Y'])

for col in 'XY':
    sns.kdeplot(data[col], shade=True)
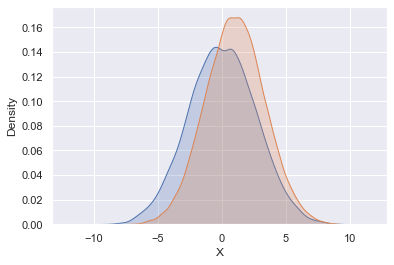
This might give a warning, but ignore that, as warnings are meant to be ignored! Naah, I am kidding, please don't ignore warnings when deploying your code to production. But here, we can.
Let's plot our favourite Iris data using Plotly next.
import plotly.express as px

iris_dataframe = px.data.iris()
fig = px.scatter(iris_dataframe, x='sepal_width', y='sepal_length', color='species',
                size='petal_length', hover_data=['sepal_length'], size_max=35)
fig.show()
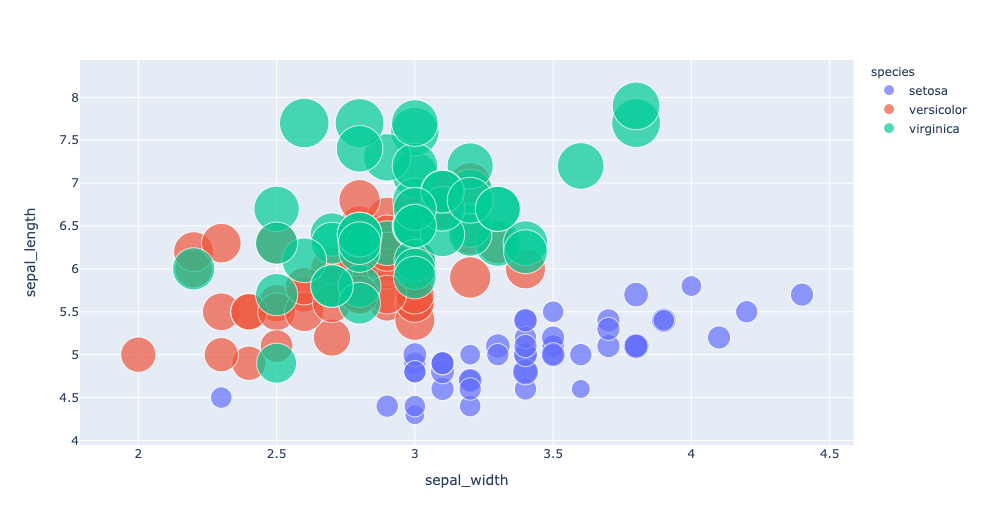
Well, that was it, the 3 plots from 3 musketeers!
Tensorflow, Pytorch, Keras - Avengers Assemble
Tensorflow, a product from Google, is an end-to-end machine learning library that helps to perform an extremely wide range of downstream tasks, with the primary focus on training and inference of deep neural networks. Tensorflow bundles together machine learning and deep learning models and algorithms.
Pytorch is Tensorflow's direct competitor developed by Facebook and is widely used in research projects. It allows almost unlimited customisation and is well adapted to running tensor operations on GPUs.
Keras is built on top of Tensorflow, which makes it a wrapper for deep learning purposes. A solid asset is its neural network block modularity and the fact that it is written in Python, which makes it easy to debug. It is not a full-fledged deep learning framework but is a nice wrapper around libraries like Tensorflow, CNTK and Theano. Keras can be used directly, however, it is inbuilt with Tensorflow 2.0.
Well, that's it from me.
I hope you got something new out of this article and got some interesting things before jumping on to these libraries.
Keep learning, keep rocking!
Just starting your Open Source Journey? Don't forget to check Hello Open Source
Need inspiration or a different perspective on the Python projects or just out there to explore? Check Awesome Python Repos
Want to make a simple and awesome game from scratch? Check out PongPong
Want to
++your GitHub Profile README? Check out Quote - README
Till next time!
Namaste 🙏


